
US Logistics Update [Oct 24, 2026]-English

With just ten days to go before the U.S. midterm elections on the 3rd of next month, U.S. media outlets are rushing to report that persistently high oil prices—which have continued for months—are emerging as the biggest factor swaying voters’ decisions. Analysts say that as gasoline and diesel prices show no signs of stabilizing, the burden of inflation has grown, and this is directly translating into political pressure for the Trump administration. In fact, according to the American Automobile Association (AAA), the national average price of gasoline—which was below $3 per gallon in late February, just before the outbreak of the war in Iran—has since fluctuated and risen to its current level of $4.30 per gallon. Since $4 per gallon is considered the “psychological threshold” that consumers perceive in the U.S., voter dissatisfaction has escalated significantly. Diesel prices—used not only in the logistics and transportation industries but also as fuel for farm machinery—have risen even more sharply than gasoline prices; the national average diesel price, which stood at $3.60 per gallon a year ago, has now surpassed $6. Experts point out that rising oil prices go beyond a mere energy issue; they are increasing overall inflationary pressures and adding to the burden on American households. With prices for groceries and daily necessities rising alongside fuel costs, consumers are experiencing greater economic hardship, and this is seen as having a major impact on President Trump’s recent decline in approval ratings. In political circles, there is a view that if high oil prices persist ahead of the midterm elections, the Trump administration—which has emphasized economic recovery—will suffer a significant blow, making gasoline and diesel prices a key issue in this midterm election.

The Brookings Institution, a leading U.S. think tank, estimates that the cost of building AI data centers, power grids, and semiconductor infrastructure in the United States will total approximately $10.3 trillion between 2025 and 2032. It has previously reported [in a September 26 newsletter] that this investment is the largest in history—exceeding even the internet investment boom—and that the annual investment volume reaches about 3.6% of U.S. GDP. In a follow-up expert discussion, it was noted that the internet investment boom, with annual investment reaching approximately 3.6% of U.S. GDP [September 26 Newsletter]. In a follow-up expert discussion, the institute examined the AI industry as a whole and highlighted another notable trend. First, it was pointed out that the AI industry is not merely a matter of the software sector but is leading to a massive infrastructure investment boom. In other words, operating AI services such as ChatGPT requires massive data centers, as well as the expansion of power grids and investment in GPUs. In particular, even as the efficiency of semiconductor chips continues to improve, AI demand is growing at a faster rate, so demand for data centers is also expected to expand steadily for the foreseeable future. However, the report also points out that as massive funds are poured into AI infrastructure, the question of how to secure investment capital is emerging as a new challenge. Companies such as Meta and Microsoft are raising funds through methods like leases, joint ventures (JVs), and private credit as their AI investment expenditures exceed their own cash generation. As these financing methods expand, the discrepancy between the actual risks associated with these investments and the liabilities reflected on corporate balance sheets is drawing attention; the analysis concludes that “hidden leverage” poses the greatest risk. This is because, under such structures, while economic risks exist, a company’s debt may appear relatively low on its balance sheet. The panelists pointed out similarities to the 2008 financial crisis in this regard, but assessed that the current situation cannot be viewed as identical to the structure of the 2008 financial crisis. As the scale of investment expands rapidly and financing methods diversify, market concerns are growing. The panelists emphasized that, given the increasing complexity of investment and financing structures, it is crucial to identify and manage future financial risks effectively. Meanwhile, this massive AI investment holds another significance for the logistics industry: the vast amounts of facilities, equipment, and components needed to build data centers, power grids, and semiconductor infrastructure will be flowing toward the United States for at least the next few years. In other words, it is important to note that a U.S.-centered, massive logistics market is taking shape.


It appears that major ports on the U.S. East Coast and the Gulf Coast are expanding their new terminals and rail infrastructure in preparation for future increases in container traffic. According to various sources, total U.S. container traffic is expected to grow at an average annual rate of approximately 2.5–3% over the next 10 years. In particular, as import sources diversify from China to Vietnam, Thailand, and India, the use of the Atlantic route through the Suez Canal is expected to expand, thereby increasing the importance of ports on the East Coast and the Gulf Coast. Consequently, Eastern Seaboard ports such as Savannah, Baltimore, and Wilmington are set to secure approximately 6.8 million TEU in additional handling capacity through the construction of new terminals, while large-scale expansion projects are also underway in Gulf Coast regions including Houston, New Orleans, and Mobile. In fact, over the past two years, import volumes from Southeast Asia to the U.S. East Coast have increased by 28%, and if the Suez Canal route returns to normal, the use of U.S. East Coast ports by cargo from Southeast Asia and India is likely to expand even further. In the long term, the trend of the center of gravity of U.S. import logistics shifting from the West Coast to the East and Gulf Coasts is expected to continue.

North American Vessel Dwell Times
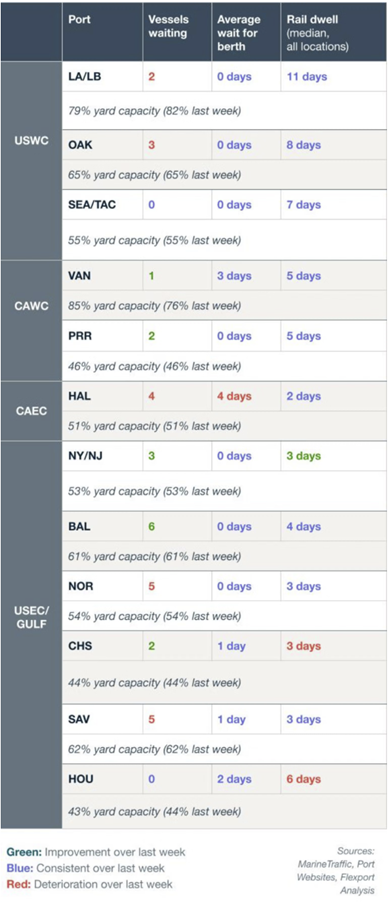
Trends in the U.S. Ocean Freight Market
The JOC reported that U.S. importers are facing a three-pronged pressure from: ① stricter CBP regulations, ② rising ocean freight rates and congestion from Asia, and ③ rising inland transportation costs in the U.S. First, as U.S. Customs and Border Protection (CBP) import regulations become stricter, U.S. importers perceive that the CBP is acting more as an enforcer than as a facilitator of trade. In other words, as cargo holds increase, the likelihood of not only customs clearance delays but also disputes over terminal demurrage is growing. Consequently, one importer of Chinese consumer goods estimates that 1–2% of its import containers in 2027 will be subject to customs holds and is factoring this into its budget. Furthermore, ocean freight costs from Asia to the U.S. have risen significantly, while service quality has actually deteriorated. Specifically, due to a surge in imports, a shortage of shipping capacity, and compounded issues such as Asian typhoons and port congestion, the on-time arrival rate in September was only 9% for shipments from Asia to the U.S. East Coast and 27% for the U.S. West Coast. Furthermore, some importers are complaining that even with contracted rates, they must pay several times the contracted rate to actually ship their cargo. In the past, it was possible to negotiate a $600 peak season surcharge down to around $300, but it is now assessed that shipping lines have gained significantly stronger bargaining power.

Inland transportation costs in the U.S. have also risen significantly, with drayage rates up 20.7% year-over-year. Dry van and flatbed rates have also risen sharply

The JOC points out that excess shipping capacity will be a key factor in 2027. While it expects excess capacity to drive down ocean freight rates starting in 2027—assuming there are no major supply chain disruptions—it notes that shipping companies can adjust supply through measures such as reducing speed or scrapping aging vessels, and therefore the actual decline in freight rates remains to be seen.

U.S. Congress Calls for Stricter Port Inspections of COSCO Ships
The chairs of three U.S. House of Representatives subcommittees—on China, intelligence, and maritime affairs—have drawn attention by urging the U.S. Department of Homeland Security (DHS) to strengthen U.S. Coast Guard (USCG) inspections of COSCO Shipping vessels. This comes in the wake of recent allegations that COSCO vessels were used for intelligence-gathering activities at U.S. ports. Lawmakers are demanding a review of the benefits granted to 11 COSCO vessels currently enrolled in the USCG’s “Qualship 21” program, which reduces the frequency and intensity of inspections based on recognized safety and compliance records. As of September 2026, COSCO is the largest carrier handling 17.5% of container traffic from Asia to the U.S. If the U.S. government actually tightens port inspections of COSCO vessels, this could affect operations and schedules at U.S. ports; therefore, caution is advised when using this carrier.
U.S. Year-End Retail Sales Forecasted to Rise 4.2%…Consumer Spending Remains Steady
The National Retail Federation (NRF) forecasts that retail sales during the November–December 2026 holiday season will reach approximately $1.013 trillion, a 4.2% increase from the previous year. This figure exceeds the actual 3.1% year-over-year growth rate in holiday retail sales recorded in 2025 and is viewed as a positive sign that U.S. consumer spending remains relatively robust despite inflation, high energy costs, and concerns about consumer sentiment. In particular, the NRF anticipates that a significant portion of this year’s growth will stem not only from simple price increases but also from actual growth in consumption. However, differences in spending power across income brackets are likely to emerge due to high oil prices, persistent inflationary pressures, high interest rates, and household debt. From a logistics perspective, the increase in year-end consumption is expected to support e-commerce and demand for restocking by retailers, thereby positively impacting freight volumes in retail, parcel delivery, and inland transportation. However, as the retail industry maintains a cautious operational stance—reflected in the NRF’s projection of 325,000 to 375,000 seasonal workers—to manage cost burdens, this year’s peak season is expected to feature a stable flow of cargo volumes based on steady consumption rather than an explosive surge in demand.

Update on the Air Freight Market from Asia to the U.S.
As production returns to normal following China’s Golden Week and the industry enters the traditional fourth-quarter peak season, air freight rates from Asia to the U.S. are surging. Rates have risen by approximately 33% from their low point in early October. The most notable trend, as expected, is the significant increase in demand not only for general e-commerce cargo but also for cargo used in building AI infrastructure. As data center investments by hyperscalers such as AWS, Microsoft Azure, Google Cloud, and Meta drive up demand for air freight of servers, semiconductors, and related high-tech equipment, freight rates are also rising sharply. Rates for a 1,000-kg shipment from Shanghai to the U.S. Midwest reached $9.09/kg, while rates to the West Coast hit $8.29/kg—both record highs for this year. According to Freightos, average China-U.S. freight rates have also risen 27% since late September to $7.13/kg. Compounding this, demand for inventory buildup ahead of November 11’s Singles Day, Black Friday, and Cyber Monday is further tightening air cargo capacity. In particular, if major tech companies secure large volumes of charter or block space in Q4, the supply available to general shippers will decrease, and upward pressure on freight rates is expected to intensify.